Logs & Terminal
Use the built-in log viewer and interactive terminal to monitor and debug running QuickStack applications.
Deployment logs
When a deployment is triggered, QuickStack streams Kubernetes events (pod scheduling, image pulls, container starts and stops) directly into the deployment log alongside the build output. This provides additional context when a deployment is slow or fails — for example, you can see whether a pod is waiting for image pull or failing readiness probes (health check).
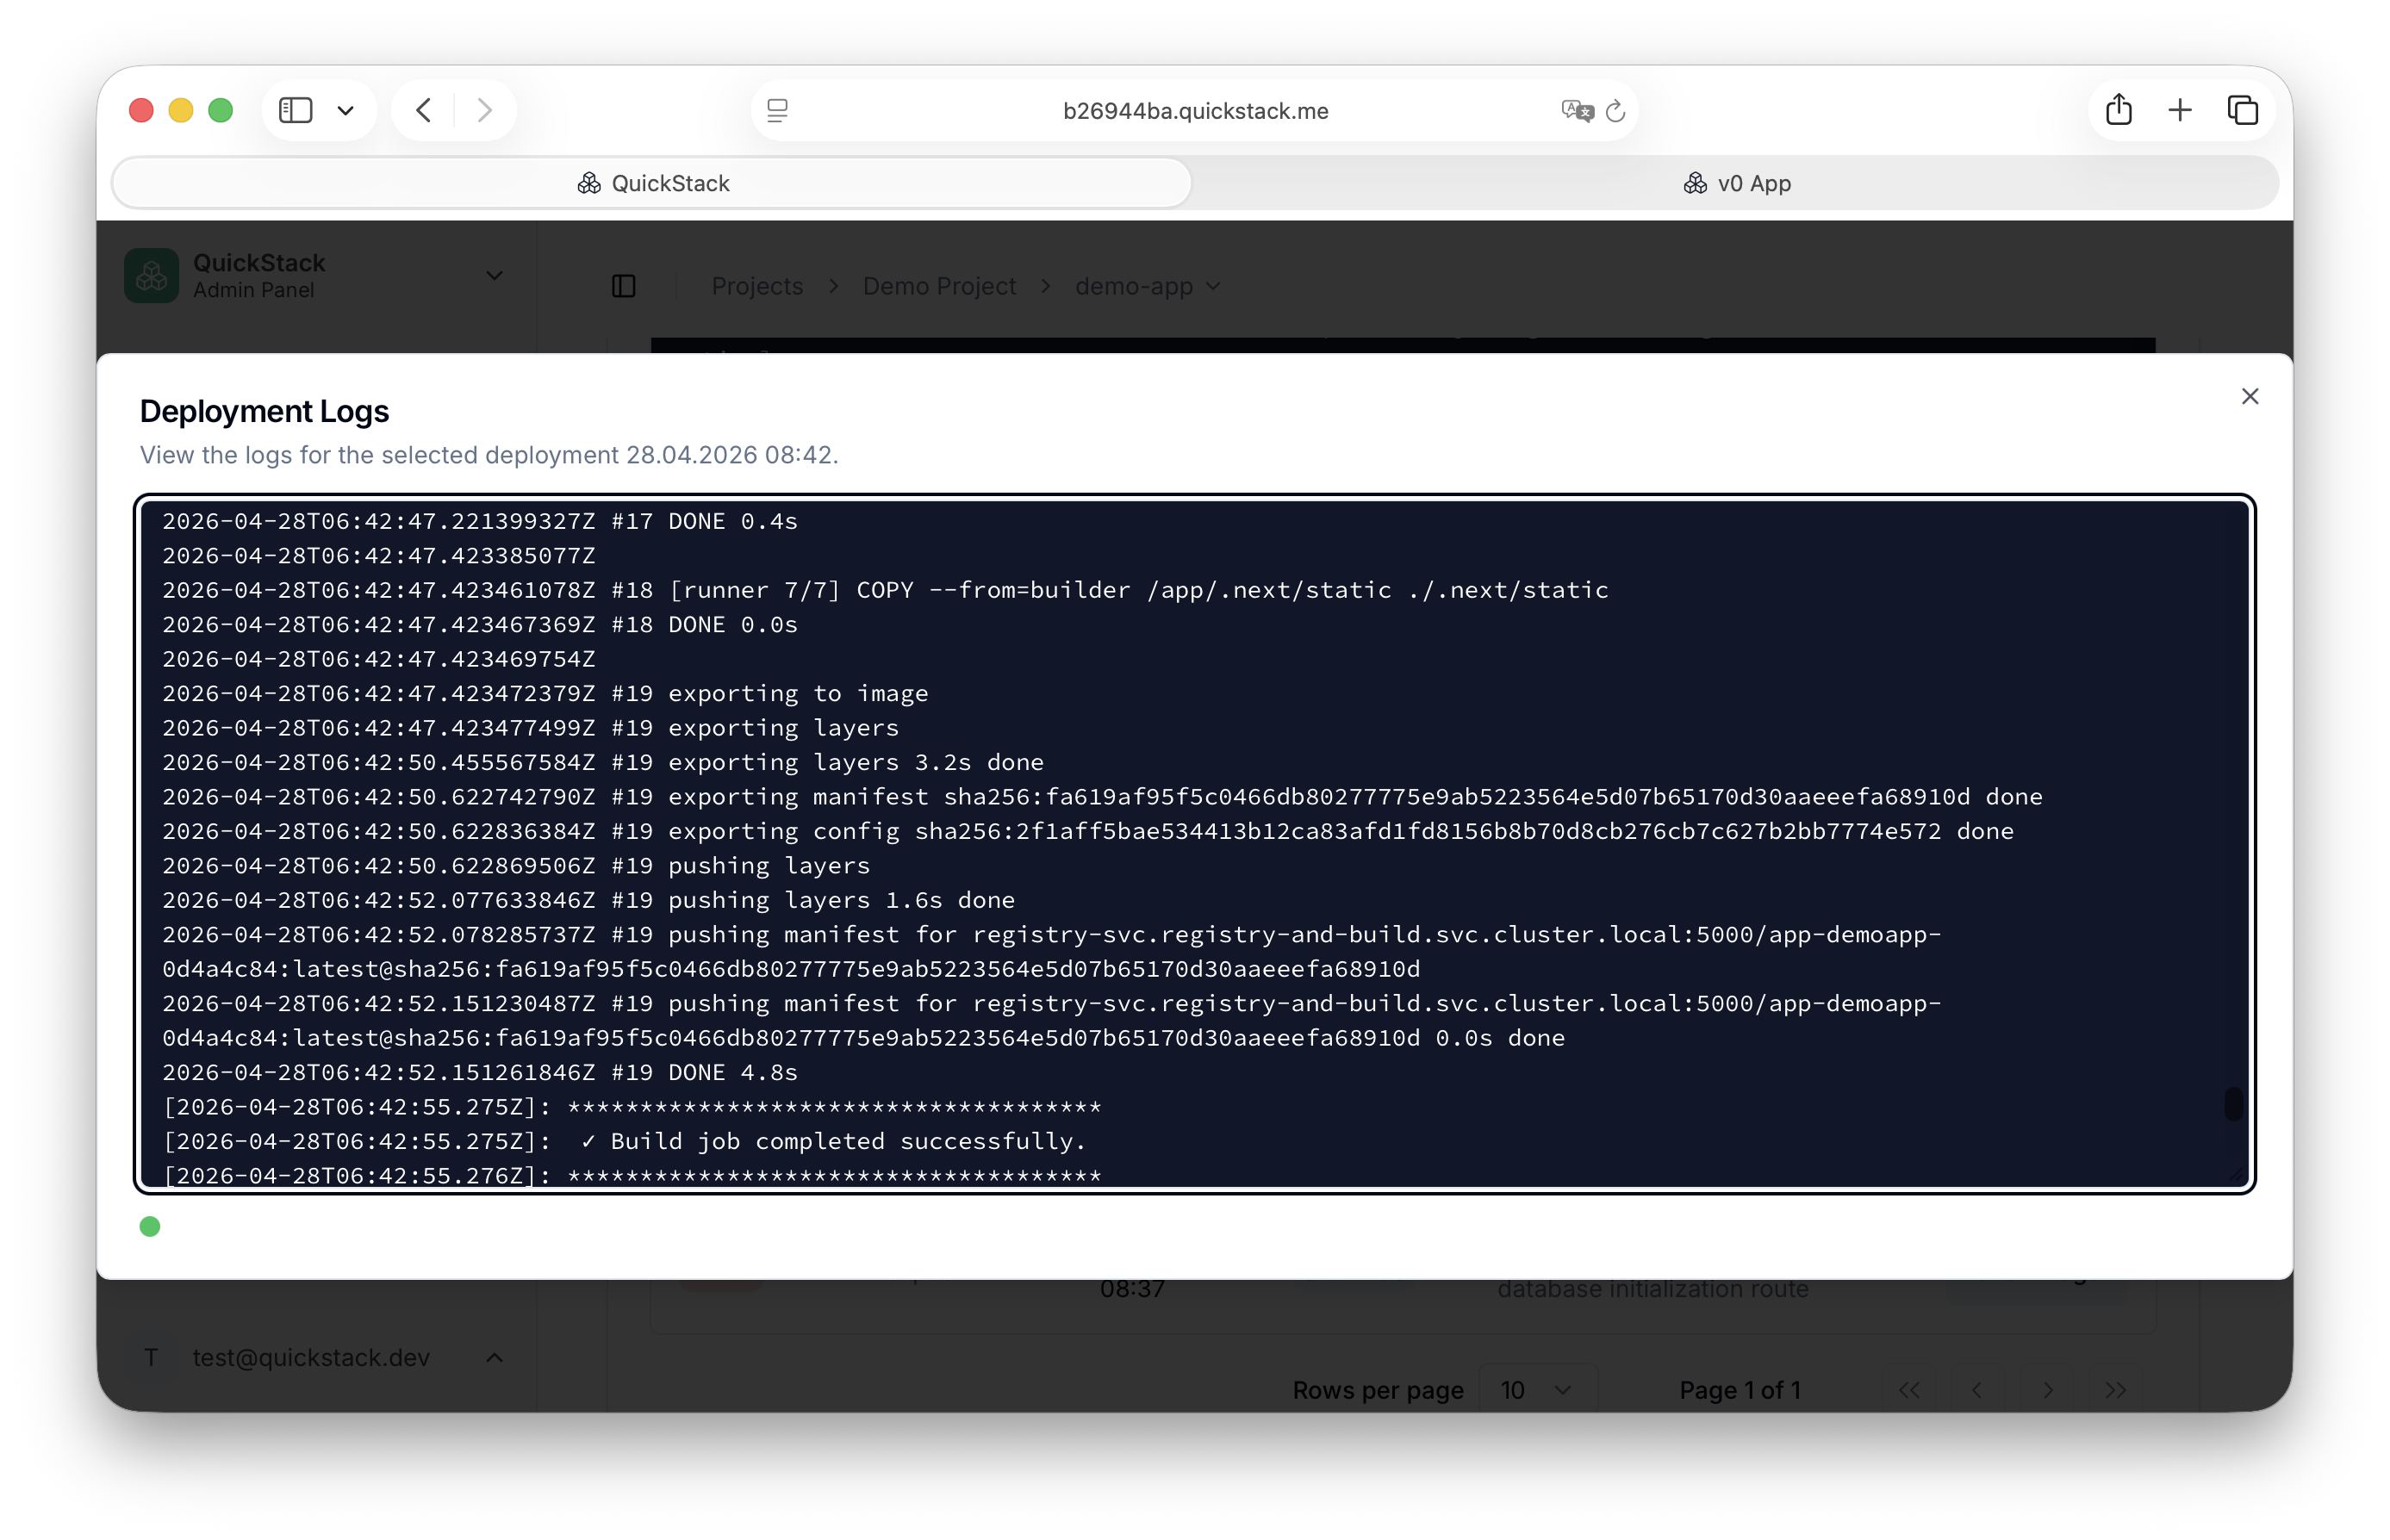
Access deployment logs from the Overview tab by clicking Show Logs next to a deployment entry, or from the global Builds page.
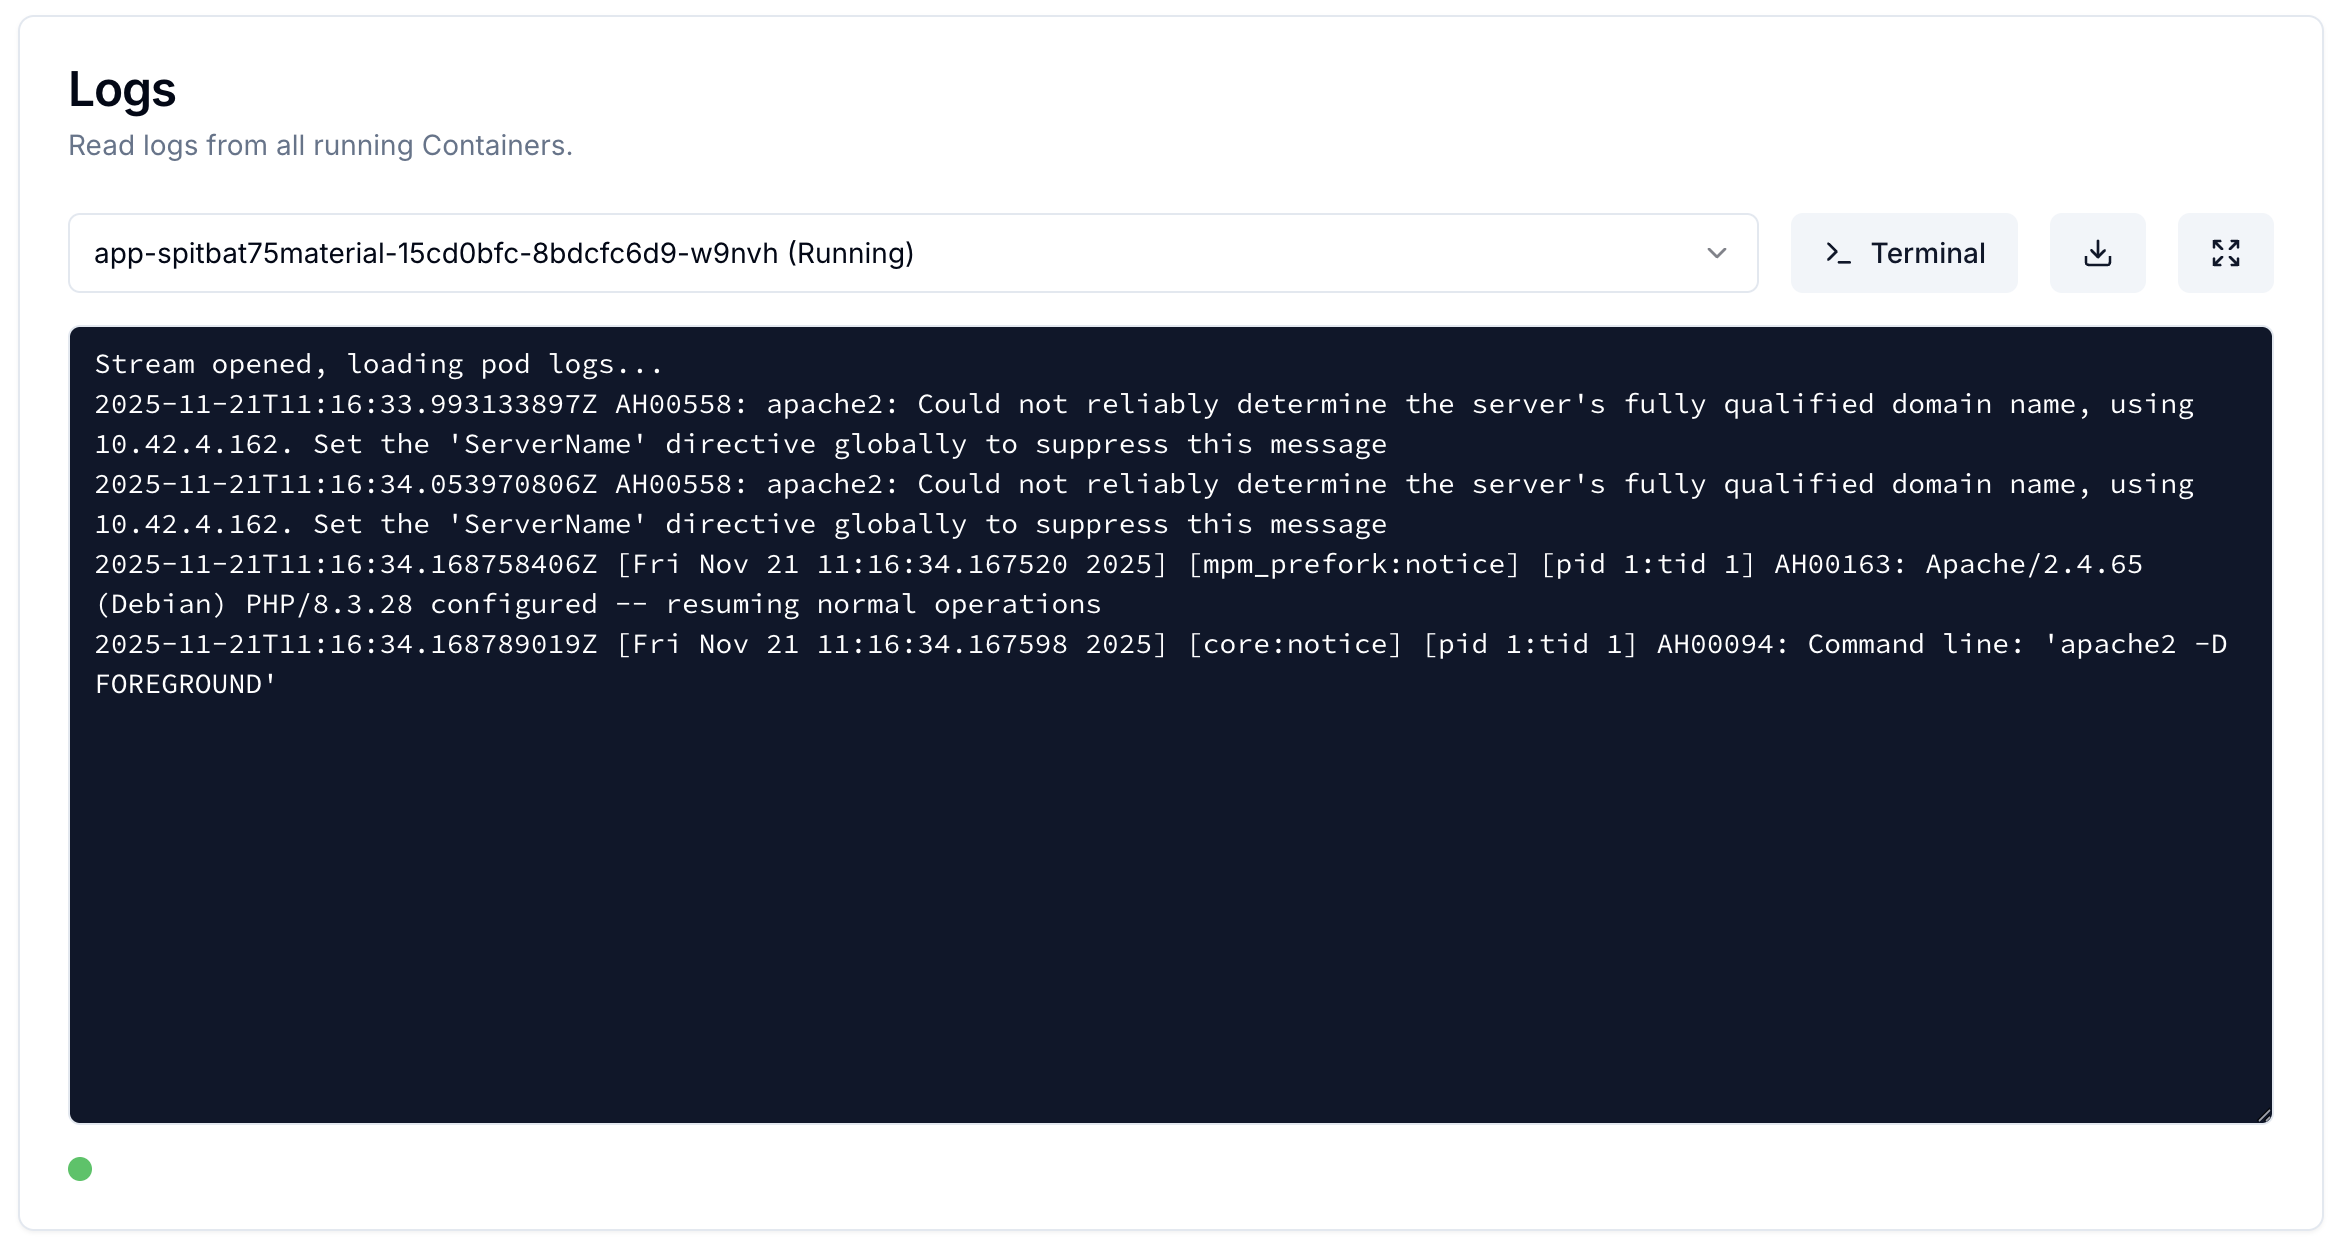
Live App logs
The Logs from running apps are streamed to the app page in QuickStack. Start here when troubleshooting.
- Open your app.
- Go to the Overview tab.
- If your app runs multiple replicas, use the pod dropdown to select which pod to tail.
Interactive terminal
The Terminal opens a shell session directly inside a running container from your browser.
Opening a terminal session
- Open your app, go to the Overview tab.
- In the Logs card, click Terminal next to the pod selector.
The Terminal button is only visible if you have Write permissions for the application.
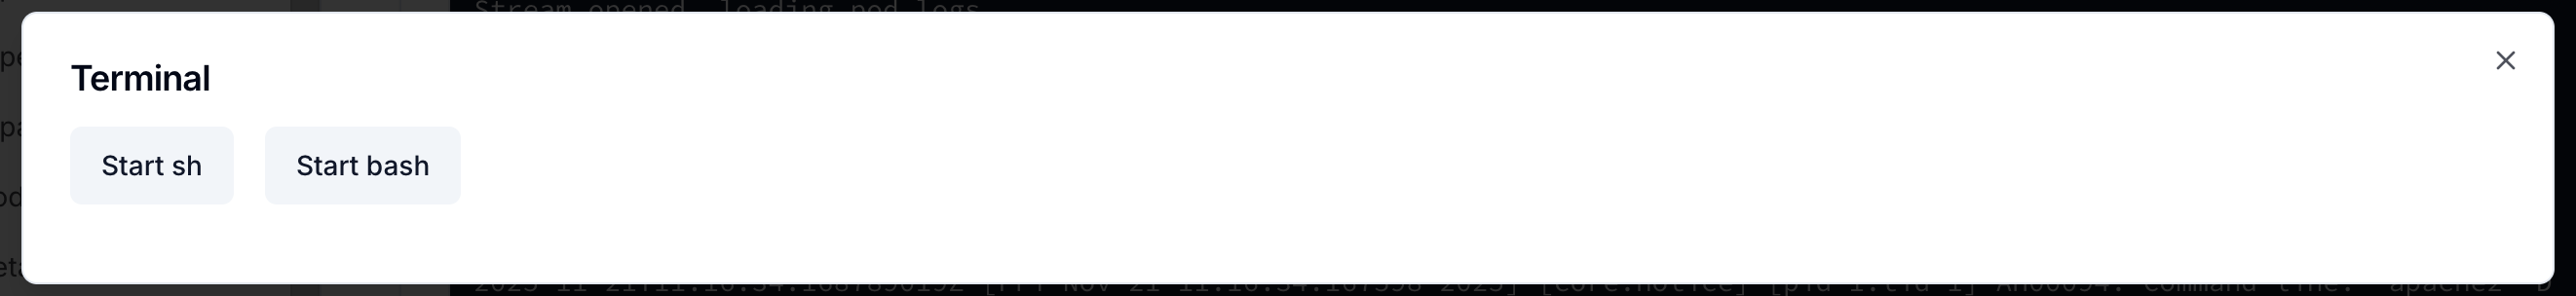
- Choose your shell:
- Start sh — available on almost all Linux containers (including Alpine)
- Start bash — richer experience; requires
bashto be installed in the image
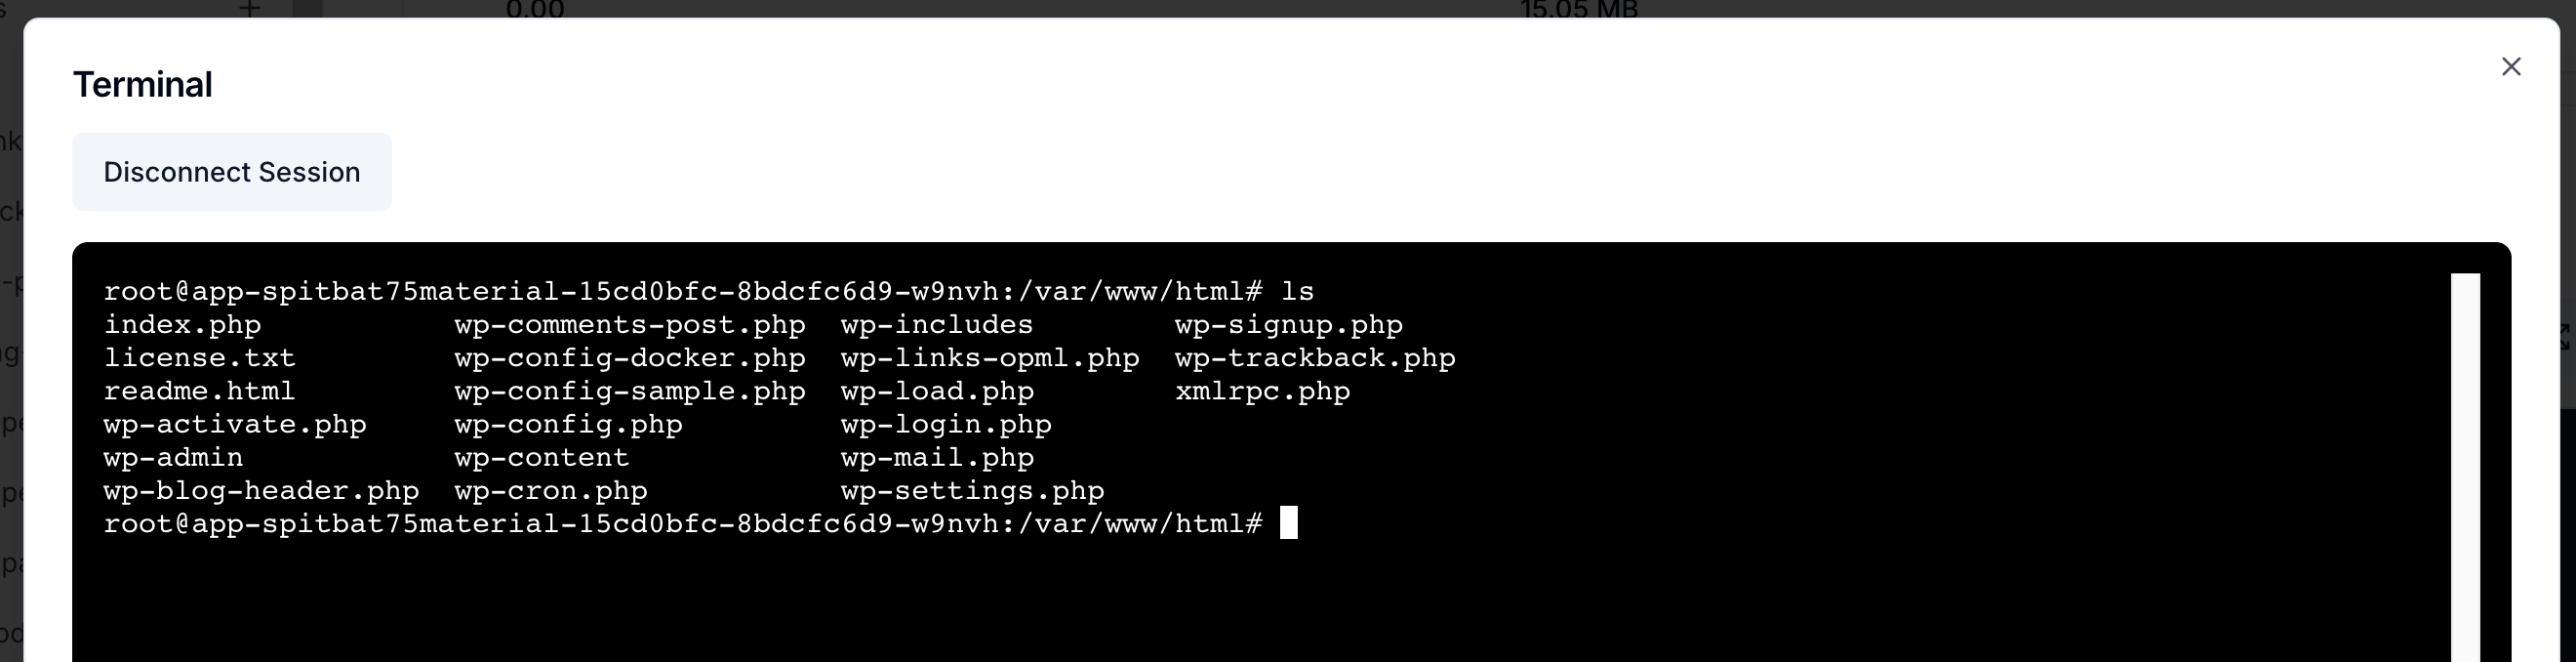
- To end the session, click Disconnect Session or close the dialog.
Limitations
| Limitation | Detail |
|---|---|
| Permissions | Terminal requires Write access to the project |
| Container state | You can only connect to Running containers; crashing containers can't be shelled into |
| Shell availability | bash requires it to be installed in the image; fall back to sh if it fails |
Related
- Health checks
- Updates & maintenance (cleanup old logs)